Pause-itively Inclined
Encouraged by a pause from the Fed which hinted at a possible end of the surge in interest rates, a broad rally in equity markets took the S&P 500 (+6.6% Jun) to a 1-year high and the VIX index to a 1-year low in June as hopes for a “soft landing” finally dragged long-dated VIX futures from their March regional banking crisis highs (chart below).
VIX futures term structure progression, 3/13/23 - 6/30/23. Source: vixcentral.com
Led by tech-centric exposures Tactical Q (+29.8% YTD) and Hedged Disruptor (+23.6% YTD), TCM strategies have largely benefitted from the rising tide to the half-way mark in 2023, including a strong showing for Hedged Yield (+6.1% YTD) which is ahead of its junk bond benchmark on the year with a net distribution yield near 13% after the addition of new single-stock exposures in July.
After leaning defensive as VIX futures remained elevated well into the spring, recent normalization has led to an increasingly pro-beta stance for Alpha Seeker which closed out the first half with two consecutive winning months, while Legacy Navigator has seen a similar evolution with the recent addition of its first-ever Nasdaq (Tactical Q) allocation in June.
Powered by “AI” optimism that has turbocharged a handful of the largest stocks in the world, markets are certainly giving the appearance of strength so far in 2023. As greed overtakes fear once again, it is worth noting that emotional markets (on the way up or down) often create allocation errors as the larger context is ignored. For example, when combined with last year’s major losses, this year’s stellar performance has only brought the “big 7” Nasdaq names back in line with the broader market decline since 2022 (chart below). Improvement is always welcome, but from this perspective, the risks going forward appear more balanced.
S&P 500 and Mega-Cap Tech price-weighted index performance, Jan 2022 - Jun 2023. Source: Yahoo Finance
divergence emergence
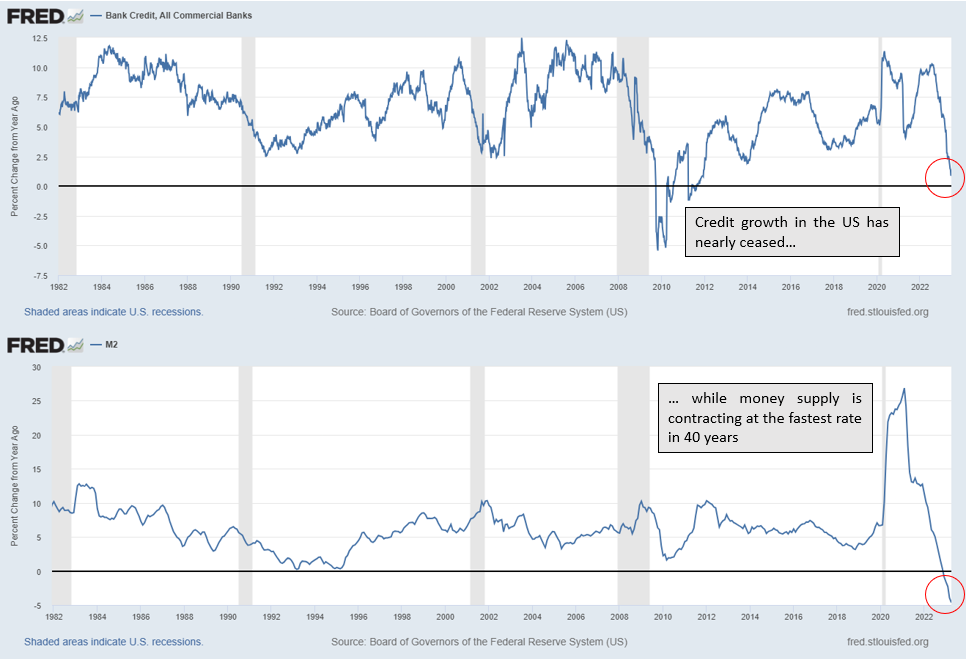
While it has recently supported markets, mega-cap dominance has also helped create a growing divergence between equity indexes and the real economy that bears watching. Most ominously, as cap-weighted stock indexes hit one-year highs, the 3-month / 10-year Treasury yield curve recently touched its most inverted level in over 40 years (chart above). As a proxy for lending profitability, it is perhaps no coincidence that yield curve inversions have preceded 5 of the last 5 US recessions since an inverted yield curve creates a disincentive to lend that can lead to a contraction in credit that slams the brakes on a debt-based economy. Judging by bank credit and money supply growth, this process is already well underway in the US (charts below).
Excluding the self-imposed economic shutdown of 2020, the average time between the first yield curve inversion and the official onset of recession is 16 months; now 8 months from the inversion in Oct 2022, markets may soon see if it really is “different this time”.
Bank Credit and M2, y/y change. Source: St. Louis Federal Reserve
As this divergence grows, investors should bear in mind that markets are becoming increasingly vulnerable to negative surprises and should one occur, optimism alone is unlikely to be a sufficient buffer. In the case of a credit contagion, VIX exposures have proven to be superior hedge and based on their strong reaction to the regional bank “mini-crisis” in March, there is every reason to believe that this will be the case again in the future.
This is not to say that defense is always warranted. Indeed, despite growing divergences, negative beta (defense) has generally been a loser over the past year as risks have so far failed to materialize. TCM portfolios may be positive beta (long markets) for now, but the VIX radar is always scanning for the next storm that may be here sooner than most believe.


