March 2021 Commentary

Rotation nation

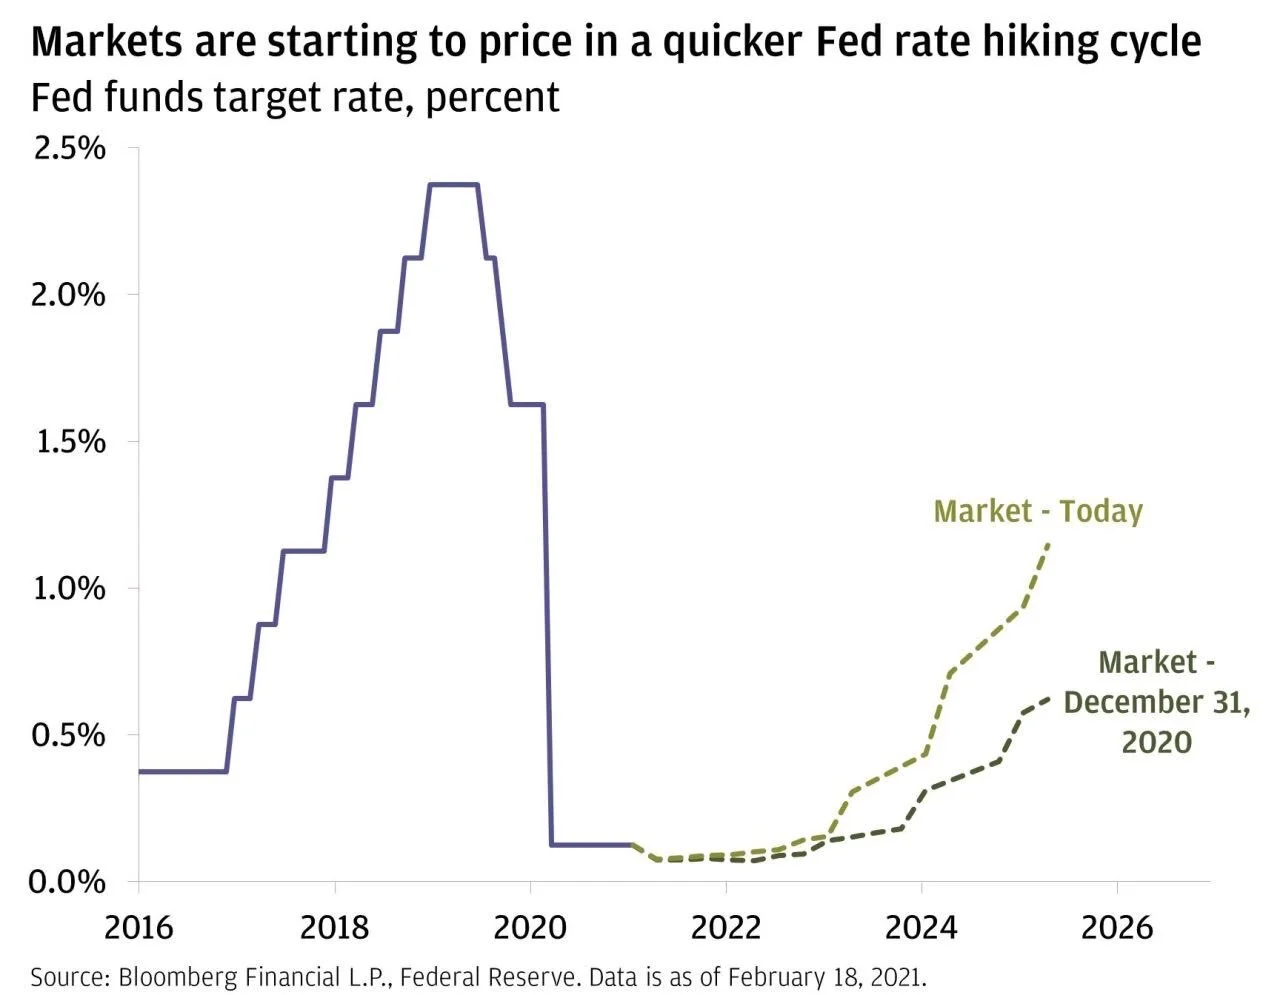
As interest rates hit a one-year high, markets continued to rotate away from large growth names in March, turning briefly violent as news of the forced liquidation of a heavily-leveraged Chinese fund made the rounds. By the end of the month most equity indexes finished higher, with smaller value exposure again benefitting at the expense of large cap growth.

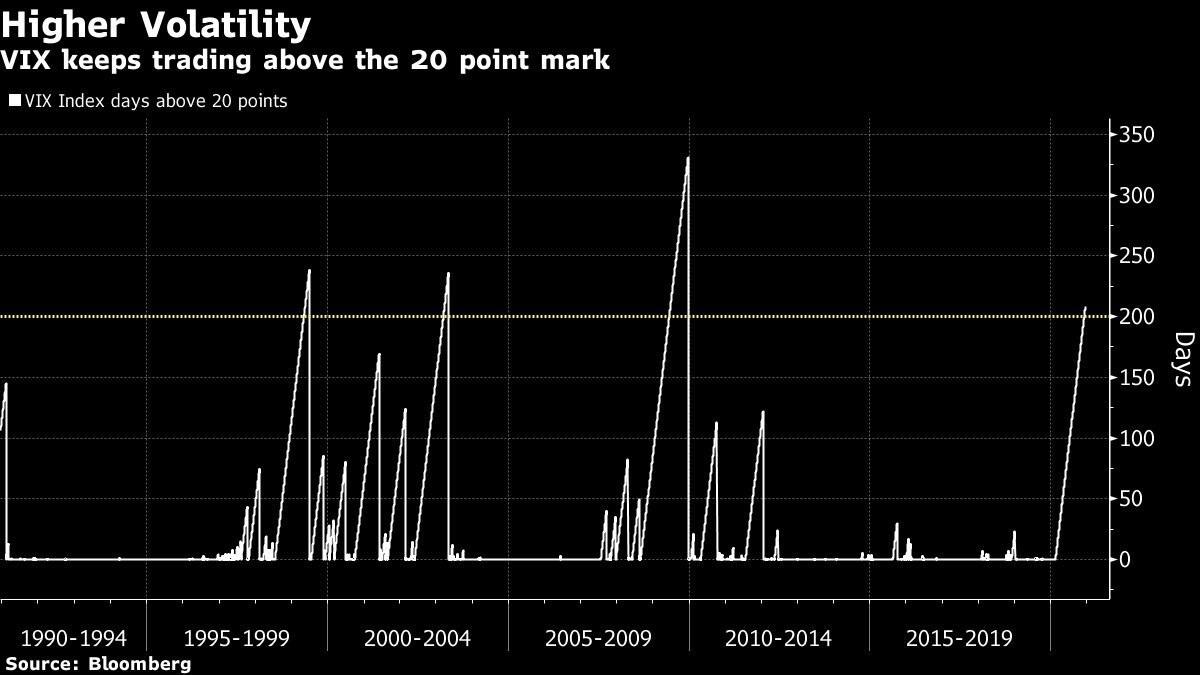
Since it responds to volatility expectations in the S&P 500 as a whole, a shuffling in the component sectors is rarely the recipe for a substantial rise in the VIX index. In fact, after some early strength the VIX fell -31% in March, potentially broadcasting an “all clear” signal as it settled below the key 20 level that has been a floor since the Corona Crisis began over a year ago. Accordingly, defensive positions were largely absent from TCM portfolios in March except for a brief appearance early in the month that weighed somewhat on performance. (see next section for more on TCM risk management)

March 2021 MTD return comparison.  Source: Yahoo Finance

March 2021 MTD return comparison. Source: Yahoo Finance

With the lone exception of Hedged Disruptor (-9.6% YTD) which has been weighed down by the ongoing rotation from growth, 2021 is off to a strong start at TCM with Alpha Seeker (+9.5% YTD) leading the way and all Smart Indexes ahead of their benchmarks on the year. As the economy reopens and the VIX tentatively exits the “crisis formation” that has been in place for over a year, the market appears ready to move on from this crisis and begin searching for the next one.

On precision

TCM’s risk management philosophy is to lessen the effect of crisis periods by basing its equity exposure on signals from the VIX. A quantitative system might imply a certain level of precision, but ultimately the Volatility Dashboard tracks human emotion which is far from precise. The success of TCM portfolios is therefore not the result of superior accuracy, but of convexity. In other words, investor behavior is difficult to predict but when it becomes irrational, it can become very irrational.

Mar 2021 Quote.jpg

In practice, this means that the majority of TCM’s hedging positions are expected to be unprofitable, with the less frequent profits outstripping more common losses. Indeed, as of March 2021, 58% of hedging trades in US Equity Smart Index have been unprofitable, subtracting an average of -0.75% from performance on all days when they have been present in the portfolio. On the other hand, less frequent profitable hedges have added an average of +1.51% to the portfolio on days when they have been used, including an astounding +19.1% during “Volmageddon” on 2/5/18 and +12% to +14% contributions on three separate days during the March 2020 “Corona Crisis”. This is convexity, and it can be powerful when used correctly.

US Equity Smart Index sample account daily hedge attribution, Nov 2016 - Mar 2021.  Source: TCM

US Equity Smart Index sample account daily hedge attribution, Nov 2016 - Mar 2021. Source: TCM

February 2021 Commentary

too much of a good thing

Rate Hike Expectations Feb 2021.jpg

After a strong start to the month, stock markets gave back a good portion of their gains late in February, spooked by a sharp increase in rate hike expectations as hopes for economic growth continue to rise with the ongoing vaccine rollout.

With an ideal trading environment that led to profitable positions in both the early rally and late correction, Alpha Seeker (+6.3% Feb) had its best non-crisis month since 2013, continuing its strong start to the year at +8.1% YTD with just 0.12 daily correlation to the S&P 500. Taking a similar approach, Smart Index strategies (EAFE +2.8%, Emerging Markets +1.7%, Smart Tech +0.5%, US Equity +3.2%) all outperformed their benchmarks for a second consecutive month by increasing exposure during the early rally before turning more defensive during the correction.

That higher growth is taken as a negative for stock indexes is a testament to how far valuations of growth companies have been stretched by investors riding a 13-year wave of cheap money. This presents an interesting conundrum: if growth becomes too widespread, it no longer commands a premium and value can suddenly become attractive. This was clearly on display in February as growth had its worst month relative to value since 2000 (see chart below), dragging Hedged Disruptor (-2.2% Feb) to its first down month since before the election.

Growth vs Value Feb 2021.png

Investment themes will always come and go, each one a lesson on the value of flexibility over pursuit of “the answer. Through the systematic flexibility of the Volatility Dashboard, this concept is woven into everything we do at TCM. Schedule a webinar today to see how we can help!

January 2021 Commentary

mob mentality

In a kind of technological riot coordinated on social media and “gamified” trading platforms like Robinhood, retail investors charged into several heavily-shorted stocks en masse in January, sparking epic squeezes that ultimately destabilized the entire market as over-exposed hedge funds scrambled to reduce risk (see gallery below). The stress came to a head in a wild final week which saw the S&P 500 fall over 3% and the VIX spike to its highest levels since the election.

Responding to signs of VIX strength in the days prior to the drama, timely volatility exposures kept TCM strategies firmly in the green during a month which saw most indexes lower (see table below). After a 62% spike in the VIX index on Jan 27 (the largest ever for a -2.5% S&P 500 day), signs of volatility fatigue from the Dashboard led to a quick about-face as TCM portfolios booked hedge profits and increased bullish exposure near month end.

Legacy Navigator net of 0.50%, Alpha Seeker and Smart Index strategies net of 1% and Hedged Disruptive Innovation net of 2% management fee.  Click for larger image

With markets recovering sharply in the early part of February, it looks as if the acute adjustment phase has run its course. As always, we will continue to follow a systematic yet flexible approach, looking to the VIX marketplace to guide our portfolio exposures.

Please feel free to contact us or schedule a webinar for further details.

2020’s Ponderous Paradoxes

external-content.duckduckgo.jpg

Stock markets at all time highs despite a record contraction in the economy. Yields near all-time lows while debt explodes worldwide. Many of the year’s hottest IPOs have never posted a profit, with one even disclosing that it doesn’t ever expect to make one. From a fundamental perspective, nothing about 2020 made much sense. See the gallery below for other assorted oddities:

Fortunately, our process is about responding to markets as they are, not as we think they should be. Conviction can be useful when investing, but in a nauseating year that saw markets ricochet from the fastest bear market in history to one of the most spectacular recoveries of the past century, flexibility was key.

Focused on the message from the VIX as the “Corona Crisis” unfolded, TCM strategies each made timely moves from defense to offense during 2020, protecting capital during the first quarter shock before moving to capitalize on the sharp recovery over the balance of the year. In the end, all strategies posted solid gains in one of the best all-around years for TCM strategies in the past decade.

Alpha Seeker: on target

Its fact sheet describes Alpha Seeker (+14.0% YTD) as “an absolute return strategy that seeks to deliver uncorrelated returns for purposes of portfolio diversification”. Right on target through a challenging year for tactical strategies, Alpha Seeker returned mid-double digits in 2020 with just 0.28 daily correlation to the S&P 500 index.

From the lowest to the highest VIX readings in history over the past decade, Alpha Seeker has proven to be a powerful diversifying exposure that can act like a hedge during crisis periods (+11% in March 2020), but also provide return in calm markets (+23% in 2017) when dedicated hedges often suffer substantial losses. More than just its attractive “right tail”, this profile subtly adds unique optionality that can improve the risk / reward tradeoff of a traditional diversified portfolio. (see table below)

Hypothetical portfolios comparison, Oct 2011 - Dec 2020. Rebalanced monthly, Alpha Seeker returns net of 1% management fee. Click for larger image.

Smart Index Family: a record year

In one of the most challenging environments in recent memory, Smart Index (+56.0% YTD) and the Legacy Navigator model (+26.3% YTD) recorded their best years since inception by deploying protection during the crisis and just as importantly, shelving it during the ensuing rally. Notably, the record 2020 results were produced in both strategies with less than 100% up-capture, the hallmark of an investment approach that seeks better results through limiting losses rather than magnifying gains. Going into its fifth year, the results of this strategy speak for themselves (see below).

Returns comparison, Nov 2016 - Dec 2020. Smart Index net of 1% management fee. "Hedged Equity Peers" is an equally-weighted composite of JP Morgan Hedged Equity (JHEQX), Swan Defined Risk (SDRIX) and Gateway Fund A (GATEX), rebalanced monthly.

In addition to the launch of Smart Tech in May this year, we are happy to announce two more additions to the Smart Index family covering MSCI EAFE (+25.7% YTD) and Emerging Markets (+19.4% YTD) indexes. Both strategies have been running with live money since Nov 2016 and have already built compelling 4-year track records, substantially outperforming their benchmarks since inception through superior risk control. With foreign indexes finally showing signs of life in late 2020, the time may be right to consider risk-managed exposure with Smart Index.

Hedged Disruptive Innovation: in the sweet spot

Hedged Disruptive Innovation (“Hedged DI”) began in August 2019 as a pilot program for applying tactical VIX hedging to a high-beta growth equity portfolio. TCM’s first departure from index-level investing, Hedged DI is a concentrated equity portfolio that carries significantly more risk than broad equity indexes but when used appropriately, may have a place in some portfolios.

Benefitting from the same defensive moves described above and benefitting from a tech-heavy portfolio firmly in the “sweet spot” for the current monetary and economic regime, the strategy returned an astounding +207.5% in its first full year.

Growth of $1000, Aug 2019 - Dec 2020.  Hedged DI returns net of 2% management fee.

Growth of $1000, Aug 2019 - Dec 2020. Hedged DI returns net of 2% management fee.

Thank you to all who helped make 2020 a success in spite of the difficult circumstances. If you haven’t done so already, be sure to schedule a webinar to learn how we can grow together in 2021!

November 2020 Commentary

typical vix in an atypical year

From a VIX perspective, the election surprised by not being very surprising. Following the typical pattern around a known deadline, hedges which had propped up the VIX ahead of the election were abandoned with the passing of the “known unknowns” of the event itself, causing a quick repricing lower in the VIX and higher in stocks immediately following the election.

In response to this message from the VIX, TCM strategies moved from defense to offense during the first week of November, with Alpha Seeker in place to profit from the slow decompression in volatility in the balance of the month while Smart Index strategies benefitted from their strategic index exposure during a strong month for equities. When it was all said and done, the S&P 500 and Nasdaq finished nearly 11% higher with the VIX receding from near-panic levels at the start of the month, though still stubbornly above normal (see chart below).

VIX futures curves, 2020 vs 2016.  Source: vixcentral.com

VIX futures curves, 2020 vs 2016. Source: vixcentral.com

process over opinion

When it comes to investing through extreme uncertainty, the election is another example of the value of process over opinion. Our process is simple: when crisis conditions are present, defend against crisis-sized losses. Not just a psychological benefit, avoiding major losses is more beneficial to portfolios than maximizing gains. This is clearly demonstrated by the substantial outperformance of Smart Index vs the S&P 500 in 2020 despite trailing the index in each up month this year- the same profile it has produced for our clients over the past four years. Even with its outstanding March return set to 0%, Smart Index would be nearly double the S&P 500 on the year through November! (see chart below).

YTD 2020 return comparison.  Smart Index net of 1% fee.  Orange line = hypothetical results setting Smart Index March 2020 return to 0% and using actual returns otherwise.

YTD 2020 return comparison. Smart Index net of 1% fee. Orange line = hypothetical results setting Smart Index March 2020 return to 0% and using actual returns otherwise.

This is the power of compounding- a concept that humans don’t easily internalize. Since investment returns compound on each other, the path of returns is as important to a portfolio’s end result as the magnitude of any one period. A risk-managed approach may not fully participate in relief rallies like we saw in November, but as this year’s results have shown, smart risk control can make all the difference for portfolios over time.