January 2020 Commentary

Led by Alpha Seeker, TCM strategies performed well in a challenging month for equity indexes as the “coronavirus” outbreak in China dented expectations for global growth. After sleepwalking higher since October, risk assets suddenly began melting as news of quarantines and a shutdown of a large portion of the Chinese economy spread in the back half of January.

Jan 2020 Return Comp.PNG

This is so far just a bump in the road for equities, but is yet another microcosm of how TCM strategies can help improve portfolios. At the start of the year there was no “market outlook” that flagged a Chinese pandemic as a risk for equities, and it was certainly not on our radar. Only by systematically assessing changes in the VIX marketplace were TCM strategies able to quickly adapt to the changing landscape and provide an offset to struggling passive strategies.

The ability of this process to adapt quickly and without relying on predictions is what sets it apart. The value it creates is in line with the duration of each new environment, bearish or bullish. So while this episode may so far be mild, it serves as a reminder of the need for investors to be prepared for anything.
November 2019 Commentary

Echoes of 2017

Reminiscent of the post-election “honeymoon” in 2017, November’s placid equity markets produced low and stable VIX readings and the steepest VIX futures curve in over three years (see chart), lifting all TCM strategies and helping to propel Alpha Seeker to its best month of 2019. As another encouraging sign, the change of character that began around the “Phase 1” trade headlines in mid-October has already produced four of Alpha Seeker’s top 5 days of 2019 as well as two of its best days since 2018.

Monthly average VIX futures curve (VX2 / VX1), 2016-2019.

Monthly average VIX futures curve (VX2 / VX1), 2016-2019.

For the time being, it appears as if markets have broken their 2-year stalemate to the upside, looking past this year’s decline in earnings with hopes of a trade deal and an acceleration in growth that always seems to be right around the corner. At new highs after being bailed out of every dip in recent memory, one could be forgiven for thinking that “diversification” is a dirty word now that indexes have seemingly become risk-free. Of course, this mindset conveniently ignores that fact that with investing, it’s not just what you make that counts, but what you keep. Students of history know the belief that “it’s different this time” should be the real worry.

Smart Index Celebrates 3 Years

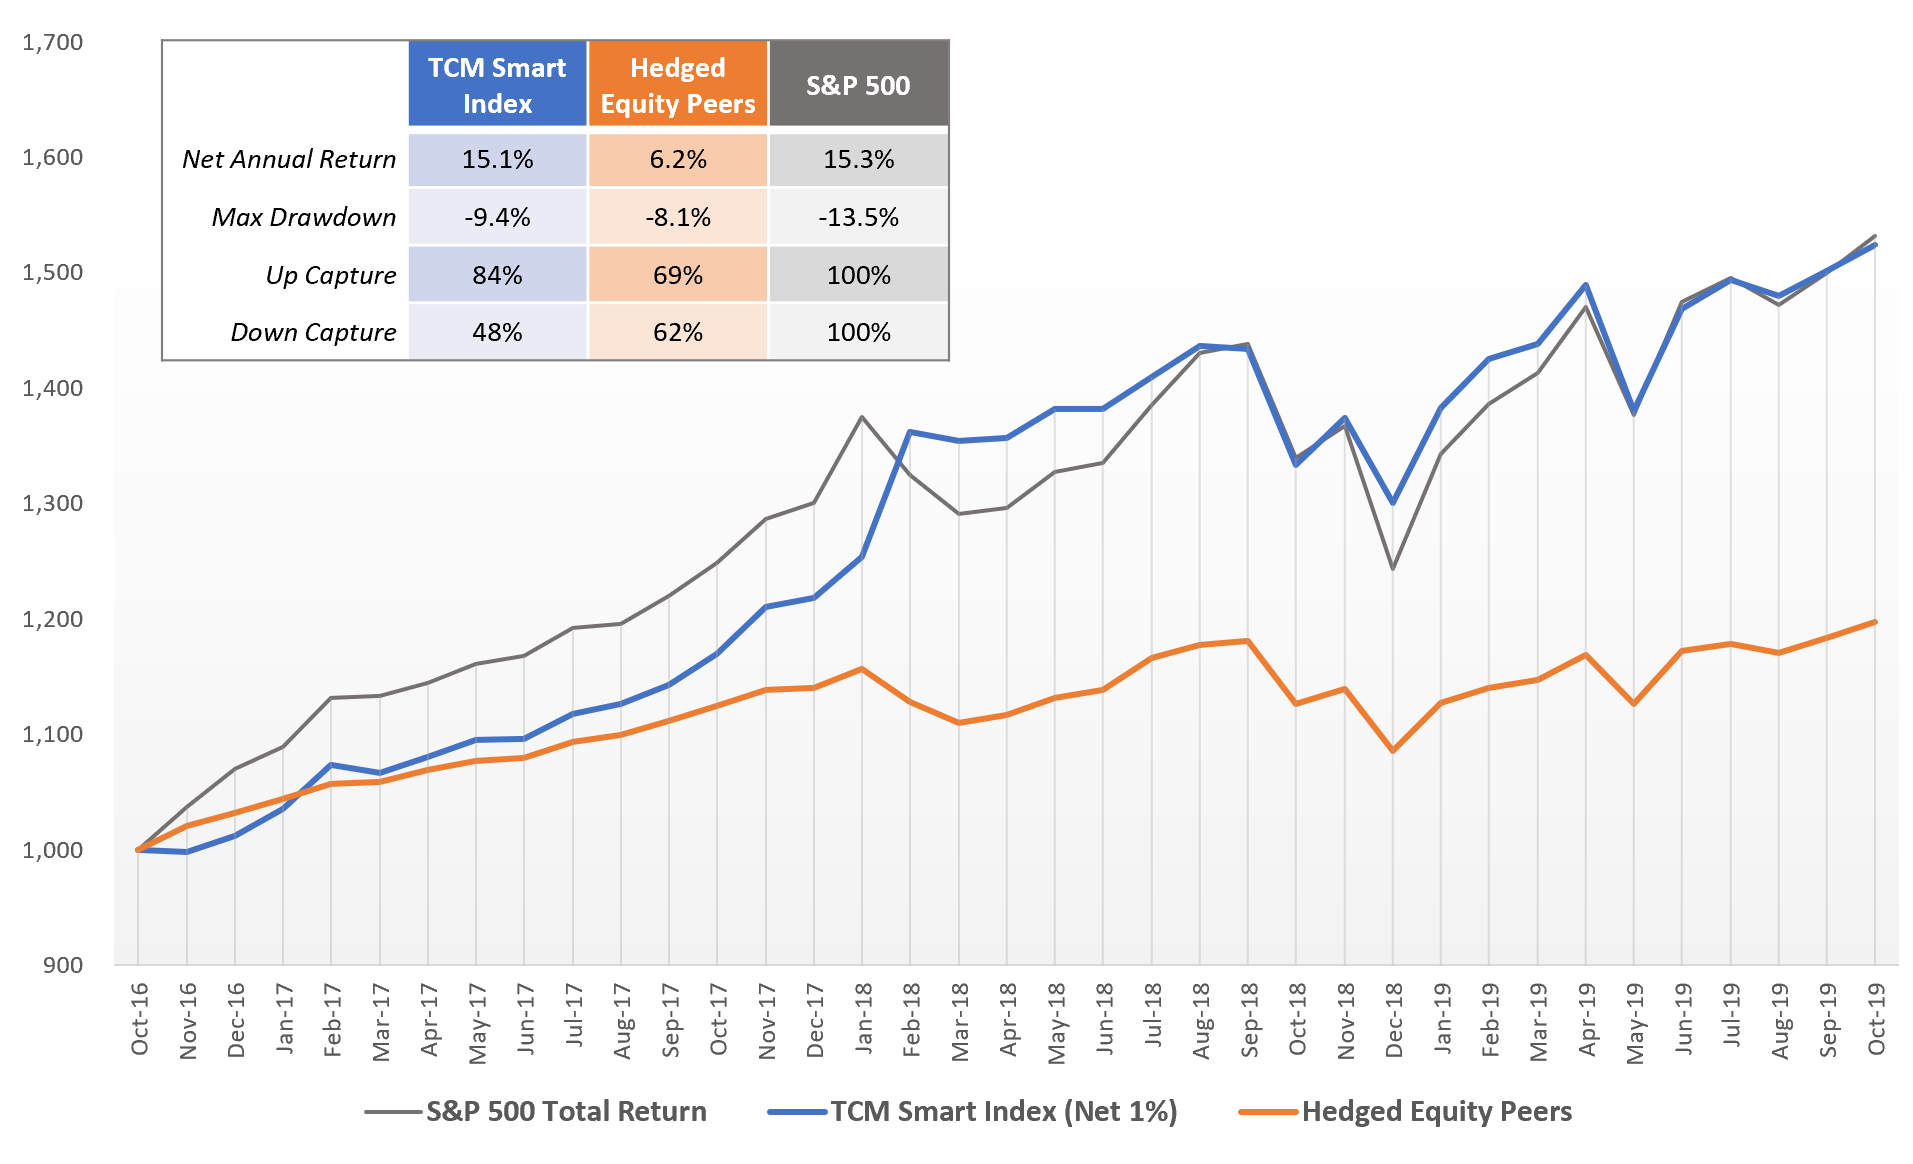
In November 2016 we started Smart Index, a novel approach to risk-managed indexing that uses tactical VIX exposure to provide downside risk mitigation with improved up-capture as compared to options-based strategies. In those 3 years, we have seen a wide range of risks including the largest 1-day VIX spike in history as well as one of the swiftest recoveries from one of the quickest bear markets ever. In short, the period since inception has provided a fertile testing ground for our approach, and we are encouraged with the results.

Growth of $1000, Nov 2016 - Nov 2019. “Hedged Equity Peers” is an equal-weighted composite of Swan Defined Risk (SDRIX), JP Morgan Hedged Equity (JHEQX) and Gateway Fund Cl A (GATEX), rebalanced monthly

Growth of $1000, Nov 2016 - Nov 2019. “Hedged Equity Peers” is an equal-weighted composite of Swan Defined Risk (SDRIX), JP Morgan Hedged Equity (JHEQX) and Gateway Fund Cl A (GATEX), rebalanced monthly

improved up-capture with tactical hedging

The major drawback of any hedging strategy is its cost. Especially for volatile equity markets, the price demanded for protection can be significant and requires a continuous “renewal” at each expiration date. During periods when the market is rising consistently, this can result in a significant drag for continuously-hedged portfolios. Many strategies look to defray this cost by simultaneously selling protection with certain characteristics, a strategy that can introduce substantial new risks if not managed properly.

S&P 500 and TCM Volatility Dashboard signals, Nov 2016-Nov 2019

S&P 500 and TCM Volatility Dashboard signals, Nov 2016-Nov 2019

Smart Index takes a fundamentally different approach, reducing the expense of insurance by owning it only under the conditions in which protection is more likely to be needed, as indicated by our Volatility Dashboard. The result is a risk-managed portfolio that has greater potential to participate in bull markets, as demonstrated by the 84% up-capture ratio for Smart Index since inception versus 69% for its Hedged Equity Peers.

BETTER down-capture with exponential exposures

While the strike price is what determines an option’s value at expiration, there are many other factors that affect its price before expiration, including the market’s current distance from the strike price, the contract’s time to expiration and the volatility of the underlying asset. This makes the outcome of options positions a “Rubik’s Cube” of sorts, dependent on the alignment of multiple factors.

Feb 5, 2018 net returns. Click for larger image

Risk management in Smart Index is expressed differently, using VIX-linked ETFs which respond solely to changes in volatility and have greater ability to move exponentially, unanchored by strike prices or time to expiration. The most vivid example of this difference was seen on Feb 5, 2018 when the S&P 500 fell over 4%, sparking a massive change in volatility and a striking difference between the reaction of VIX products like VXX and the Rubik’s Cube pricing of options. While both approaches succeeded in reducing risk, the exponential nature of VIX was on full display that day.

A natural complement to other hedged strategies

With the bull run now entering an unprecedented second decade, allocators are increasingly turning to hedged equity strategies, with $16B across the three funds in the “Hedged Equity Peers” composite alone. Nearly all of this hedged equity universe relies on options for protection, a strategy with an admirable track record of mitigating downside and an equally-consistent history of underperformance in bull markets. Smart Index was created to fill this void by focusing on tactical hedging with exponential VIX exposures, a strategy that has improved “up-capture” without sacrificing downside protection since its inception three years ago.

Of course, investing is always about trade-offs and there is no perfect strategy. While the tactical approach in Smart Index has a proven ability to capture a greater share of bull markets, “always on” strategies are better-equipped to protect from sudden market shocks. Similarly, while VIX exposures have a greater ability to move exponentially during turbulent markets, the diversity of pricing factors can make options-based protection a more consistent exposure.

Portfolio statistics, Nov 2016-Nov 2019. “50% Smart Index / 50% Hedged Eq” portfolio is pro-forma blend, rebalanced monthly

Both approaches have merit independently, but their natural complements can also make for a powerful combination. For example, an equal allocation to Smart Index and the Hedged Equity Peers composite would have produced higher return than the Hedged Equity Peers since Nov 2016 with less volatility than Smart Index while significantly reducing risk versus an unhedged index exposure (see table).

With infinite combinations to suit any risk preference, Smart Index deserves a place in every risk-managed equity allocation. Here’s to a great 3 years and many more to come.