

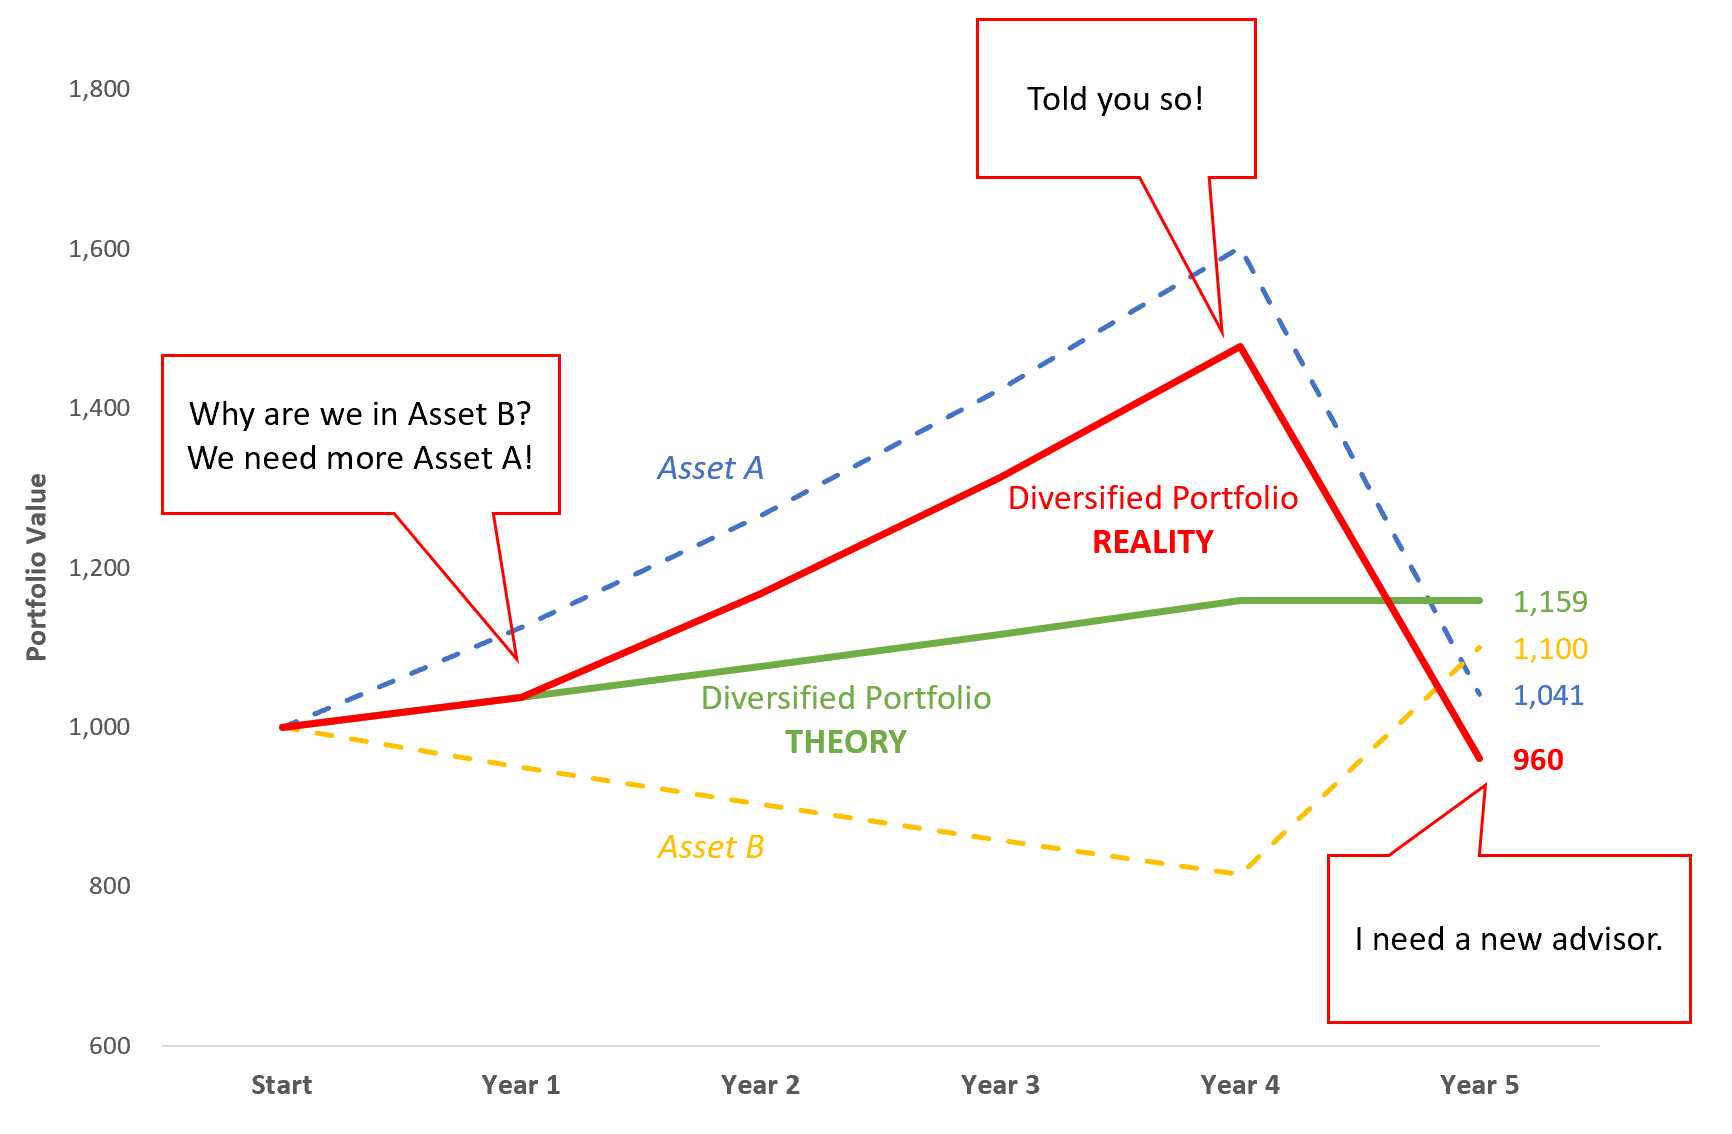
Theoretical growth of $1000, for illustrative purposes only. “Diversified Portfolio THEORY” is 50% Asset A, 50% Asset B, rebalanced annually. “Diversified Portfolio REALITY” is 50% Asset A, 50% Asset B in Year 1, then 100% Asset A thereafter.
November 2019 Commentary
Echoes of 2017
Reminiscent of the post-election “honeymoon” in 2017, November’s placid equity markets produced low and stable VIX readings and the steepest VIX futures curve in over three years (see chart), lifting all TCM strategies and helping to propel Alpha Seeker to its best month of 2019. As another encouraging sign, the change of character that began around the “Phase 1” trade headlines in mid-October has already produced four of Alpha Seeker’s top 5 days of 2019 as well as two of its best days since 2018.

Monthly average VIX futures curve (VX2 / VX1), 2016-2019.
For the time being, it appears as if markets have broken their 2-year stalemate to the upside, looking past this year’s decline in earnings with hopes of a trade deal and an acceleration in growth that always seems to be right around the corner. At new highs after being bailed out of every dip in recent memory, one could be forgiven for thinking that “diversification” is a dirty word now that indexes have seemingly become risk-free. Of course, this mindset conveniently ignores that fact that with investing, it’s not just what you make that counts, but what you keep. Students of history know the belief that “it’s different this time” should be the real worry.
Smart Index Celebrates 3 Years
In November 2016 we started Smart Index, a novel approach to risk-managed indexing that uses tactical VIX exposure to provide downside risk mitigation with improved up-capture as compared to options-based strategies. In those 3 years, we have seen a wide range of risks including the largest 1-day VIX spike in history as well as one of the swiftest recoveries from one of the quickest bear markets ever. In short, the period since inception has provided a fertile testing ground for our approach, and we are encouraged with the results.
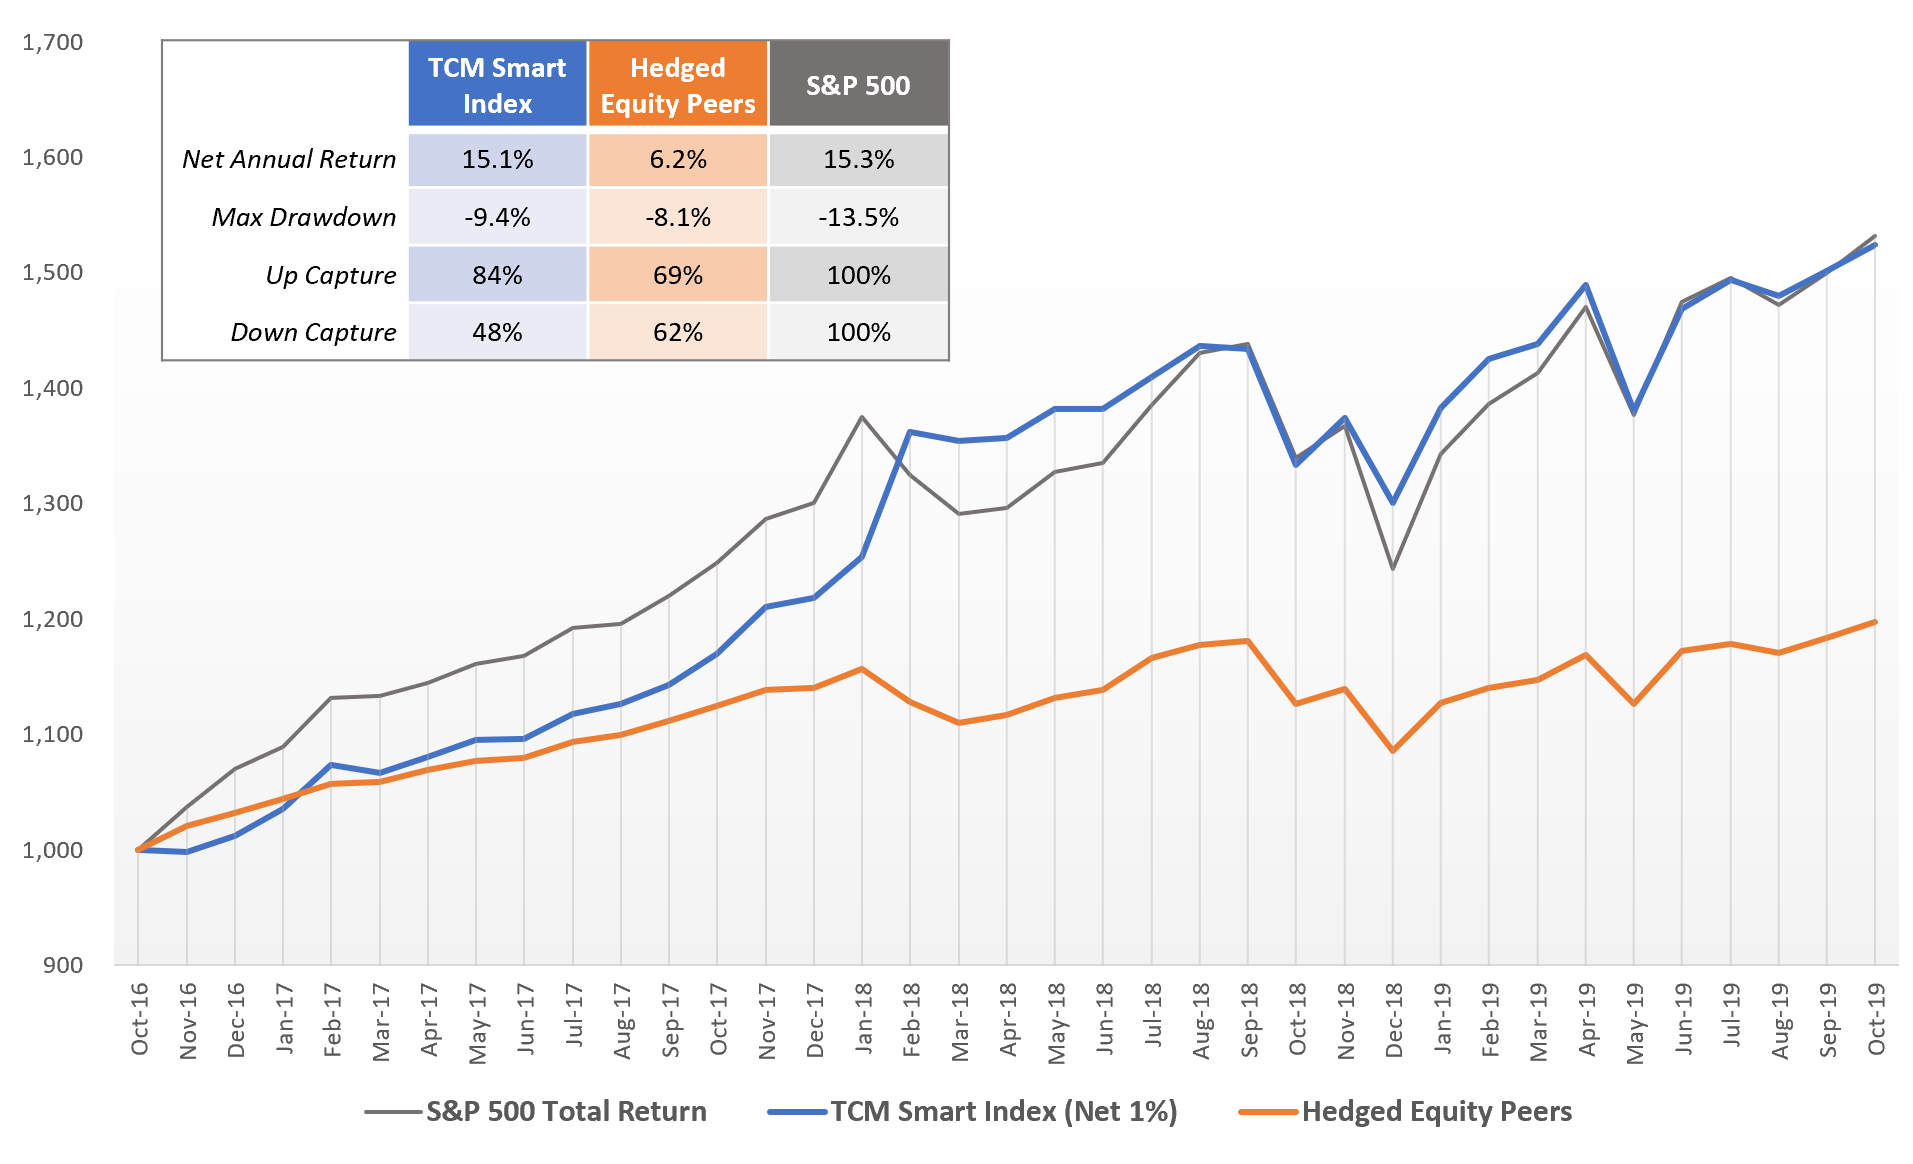
Growth of $1000, Nov 2016 - Nov 2019. “Hedged Equity Peers” is an equal-weighted composite of Swan Defined Risk (SDRIX), JP Morgan Hedged Equity (JHEQX) and Gateway Fund Cl A (GATEX), rebalanced monthly
improved up-capture with tactical hedging
The major drawback of any hedging strategy is its cost. Especially for volatile equity markets, the price demanded for protection can be significant and requires a continuous “renewal” at each expiration date. During periods when the market is rising consistently, this can result in a significant drag for continuously-hedged portfolios. Many strategies look to defray this cost by simultaneously selling protection with certain characteristics, a strategy that can introduce substantial new risks if not managed properly.

S&P 500 and TCM Volatility Dashboard signals, Nov 2016-Nov 2019
Smart Index takes a fundamentally different approach, reducing the expense of insurance by owning it only under the conditions in which protection is more likely to be needed, as indicated by our Volatility Dashboard. The result is a risk-managed portfolio that has greater potential to participate in bull markets, as demonstrated by the 84% up-capture ratio for Smart Index since inception versus 69% for its Hedged Equity Peers.
BETTER down-capture with exponential exposures
While the strike price is what determines an option’s value at expiration, there are many other factors that affect its price before expiration, including the market’s current distance from the strike price, the contract’s time to expiration and the volatility of the underlying asset. This makes the outcome of options positions a “Rubik’s Cube” of sorts, dependent on the alignment of multiple factors.
Feb 5, 2018 net returns. Click for larger image
Risk management in Smart Index is expressed differently, using VIX-linked ETFs which respond solely to changes in volatility and have greater ability to move exponentially, unanchored by strike prices or time to expiration. The most vivid example of this difference was seen on Feb 5, 2018 when the S&P 500 fell over 4%, sparking a massive change in volatility and a striking difference between the reaction of VIX products like VXX and the Rubik’s Cube pricing of options. While both approaches succeeded in reducing risk, the exponential nature of VIX was on full display that day.
A natural complement to other hedged strategies
With the bull run now entering an unprecedented second decade, allocators are increasingly turning to hedged equity strategies, with $16B across the three funds in the “Hedged Equity Peers” composite alone. Nearly all of this hedged equity universe relies on options for protection, a strategy with an admirable track record of mitigating downside and an equally-consistent history of underperformance in bull markets. Smart Index was created to fill this void by focusing on tactical hedging with exponential VIX exposures, a strategy that has improved “up-capture” without sacrificing downside protection since its inception three years ago.
Of course, investing is always about trade-offs and there is no perfect strategy. While the tactical approach in Smart Index has a proven ability to capture a greater share of bull markets, “always on” strategies are better-equipped to protect from sudden market shocks. Similarly, while VIX exposures have a greater ability to move exponentially during turbulent markets, the diversity of pricing factors can make options-based protection a more consistent exposure.
Portfolio statistics, Nov 2016-Nov 2019. “50% Smart Index / 50% Hedged Eq” portfolio is pro-forma blend, rebalanced monthly
Both approaches have merit independently, but their natural complements can also make for a powerful combination. For example, an equal allocation to Smart Index and the Hedged Equity Peers composite would have produced higher return than the Hedged Equity Peers since Nov 2016 with less volatility than Smart Index while significantly reducing risk versus an unhedged index exposure (see table).
With infinite combinations to suit any risk preference, Smart Index deserves a place in every risk-managed equity allocation. Here’s to a great 3 years and many more to come.
Recently Forgotten

Recency bias. Source: NY Times
In psychology, "recency bias” is the term that describes our tendency to use the recent past as the baseline for what will happen in the future. While recent action in markets might suggest that 20 is a ceiling for the VIX Index, that idea is absolutely not supported by the full VIX data set. Far from a cap, the “bear market” zone above 20 is actually the second most common level for the VIX, comprising 36% of all closes since 1990.
Recency bias has the ability to turn what were extremely impactful, emotional periods into an historical relic. With many painful events this is more a blessing than a curse, but for historically common investment “traumas”, it can lead to an overly-lax attitude about risk, especially at the end of bull markets when it is needed most. On the 11th anniversary of one of the worst-ever periods in modern markets, it’s eye-opening to re-live the emotion of these experiences as they happened:
It has become popular to dismiss the events of 2008 as a freak occurrence that were completely unpredictable and never to be repeated. In reality, there were many warning signs that provided those who were paying attention ample time to prepare. In particular interest for our process was the change in character in the VIX complex starting more than a year prior, in February 2007.
S&P 500 Volatility Risk Premium, 2004-2007
After spending months near the lowest readings in history, on Feb 27, 2007 the VIX index spiked +64% on news of a dramatic decline in Chinese stocks, its largest one-day move in history to that point. It was not known at the time, but this event set in motion a steady climb for volatility that would eventually culminate 20 months later in the panic of 2008. In the early stages of this period, disruption of the typical “looping” process in the VIX meant that rather than the usual over-estimation, expectations for volatility were often met or exceeded. Like recent experience, this narrowing of the so-called “Volatility Risk Premium” (VRP) impacted strategies designed to profit from it, with Alpha Seeker notching the only down year in its backtest period while the S&P 500 posted a gain in 2007.

This environment stretched into the first half of 2008 as economic data continued to deteriorate and other warning signs mounted, most notably the failure of Bear Stearns which caused the VIX to briefly break 30 in March. Even still, markets remained resilient as the Fed aggressively cut interest rates while assuring investors that it was not forecasting a recession. After the rescue of Bear Stearns, the S&P 500 regained its footing as the VIX fell sharply and VRP briefly reappeared for a few weeks through mid-May. Then the real trouble started.
With the housing market continuing to crumble and as banks began to fail throughout the summer, it became increasingly clear that lending giants Fannie Mae and Freddie Mac would need assistance if they were to survive. With rumors now swirling about the viability of investment firms with sub-prime mortgage exposure, the VIX resumed its climb, surpassing 30 for the third time on the year on news of the failure of Indy Mac bank in July. In a final “warning shot”, a burst of hope around the rescue of Fannie Mae and Freddie Mac was not enough to push the VIX sustainably out of the “bear market zone” above 20. By the end of August, with Alpha Seeker flat on the year after struggling through 18 months of dwindling VRP amid a faltering stock market, the fireworks were ready to begin.
Contrary to popular belief, very high VIX values do not come from a rogue event- they are typically the result of financial contagion in which a single shock propagates out in multiple directions at once, exponentially increasing uncertainty. Beginning with the nationalization of Fannie Mae and Freddie Mac, the timeline of events in the fall of 2008 is a classic example and importantly, one that would have been possible to avoid or even profit from in real-time using the right indicators.

VIX Index and Futures, Sep-Oct 2008. Source: CBOE, TCM
The chart above shows the VIX Index (grey line and black dots), VIX futures (red dots, inset chart) and just a portion of some of the major headlines during the September - October 2008 period. Aside from the sheer drama of that time, what is most striking to us is the fact that the VIX futures curve first inverted (1st VIX future price closed higher than 2nd VIX future price) only after the Lehman Brothers bankruptcy on Sep 15th, with the futures at roughly 25. In other words, at the gateway to one the most devastating periods for markets in this century, there was a warning sign.
An inversion of the VIX futures curve is one of the primary signals in our system and those who heeded it on Sep 15, 2008 could have benefited as volatility exploded in the ensuing chaos, despite the coordinated efforts of world central banks to control it. Although the product hadn’t yet listed, the index tracked by the iPath Short Term VIX Futures ETN (VXX) jumped as much as 273% from Sep 15th through year end. With a move of this magnitude, it doesn’t take much exposure to make a meaningful difference for a portfolio, whether from a discreet allocation to Alpha Seeker as part of a diversified portfolio or with an integrated risk-managed exposure like Smart Index.
For passive index exposures, the damage from these few months erased 11 years of gains and took another 6 years to recover- assuming an investor had the luxury of that much time to spare. Unfortunately for many others, 2008 permanently impaired their retirement plans and was never fully recovered. Even a partial offset of the bear market losses could have bought those investors valuable time as their portfolios would have resumed compounding much sooner during the post-2008 recovery. Rather than a once-in-a-lifetime event, the same can be said of any of the bear markets that have occurred in every decade of the last 70 years.
At TCM, we believe better portfolios come from a focus on compounding- the “eighth wonder of the world” and the key to maximizing a portfolio’s long-term value. This is a task that requires as much attention to risk management as it does to maximizing upside, and is why we designed risk-responsive investments that can be incorporated into most any portfolio.
A Matter of Time
Our portfolio management system is built around the philosophy of owning market protection only when “crisis” or bear market conditions are present in the VIX marketplace. This results in portfolios that tend to do best while the VIX is either over 20 (bear markets) or under 18 (bull markets), two zones together accounting for 90% of VIX Index closes since its inception in 1990 (see chart below).
VIX Index Phase History 1990-2019. Source: TCM. Click for larger image
Referencing price levels might imply a purely directional cause-and-effect, but the decay element of VIX contracts also makes time a major factor in their price movement, especially when decay is strongest: under 18 or over 20 in the VIX index. For our strategies, the bottom line is that the longer the VIX Index spends in either zone, the more likely it is that a given position will be profitable. This is most easily observable in Alpha Seeker’s market-beating return during 2017 while the VIX index remained below 18 for the entire year, or over the past 8 years when 78% of VIX closes have been under 18. This is very common behavior for the VIX during bull markets and is beneficial for inverse VIX or long S&P exposures while it persists. On other end of the spectrum is the situation seen only in brief flashes since Alpha Seeker’s inception, when long VIX positions benefit while the VIX clusters above 20– common during crisis periods and bear markets in equities (red bars in the chart above). Perhaps the “gold standard” of this type of environment was during the Financial Crisis in 2008 when nearly 90% of that year’s daily VIX closes were over 20 as the VIX averaged 32.69 for the year. In 2008, the S&P 500 lost a shocking -37% while the Alpha Seeker strategy posted the best year in its backtest period (+41%).

S&P 500 Index Jan 2018 - Sep 2019
This leaves the relatively rare VIX index readings between 18 and 20 which have historically clustered around transitions between bull and bear markets (yellow bars in chart above). During these periods, the decay factor in VIX contracts is often overwhelmed by increasingly erratic movements in the VIX Index, effectively turning VIX positions into a low-odds directional play on the VIX Index. Beyond the mirage of a year-to-date return calculated from the bottom of a sharp “V”, this describes the period since Jan 2018 well. As recently as Oct 3rd, the stock market had returned less than T-Bills since the market peak in Jan 2018 as the VIX index has increasingly tested and retreated from the “bear market zone”, crossing the 18-20 threshold an astounding 25 times in 2019 alone. Reflecting the volatility of the VIX and the lack of consistent decay described above, since Jan 2018 nearly every VIX ETF and ETN, long or short, has posted a loss. This is the behavior of a market between bull and bear phases.
While a bear market is certainly not guaranteed, the odds of one are now objectively as high as they’ve been since 2007 (see NY Fed Recession Probability). Adding to the risk for investors, the most attractive recent returns in this environment have been from passive indexes which by definition provide no protection against a bear market. This presents a conundrum for advisors who may feel compelled to choose between protecting or keeping their clients, or for investors torn between the fear of missing out and the fear of a market decline. As advisors and investors facing the same challenges, we set out to design strategies that offer a better compromise– visit our strategies pages to learn more.