

STEEPEST VIX CURVE OF 2019 LIFTS ALPHA SEEKER PAST S&P IN JULY
Led by Alpha Seeker, all three TCM strategies posted strong returns in July as markets seemed to be on autopilot ahead of a widely-expected rate cut at the 7/31 Fed meeting.
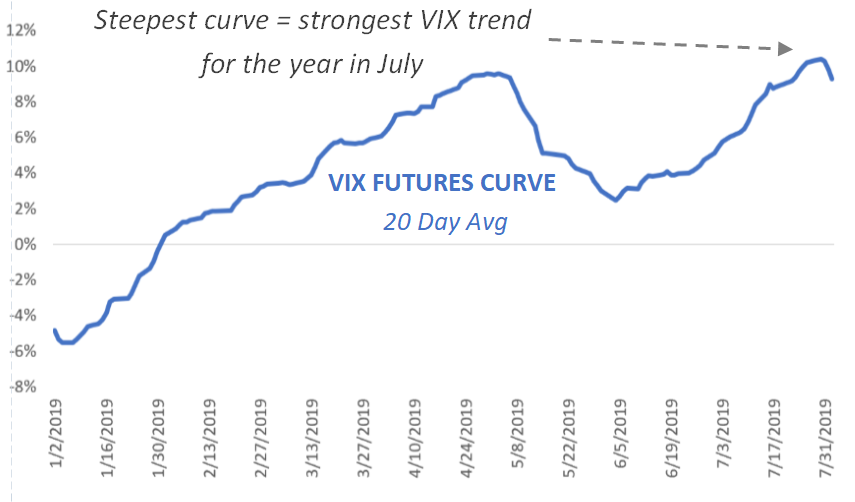
2nd VIX future daily settlement / 1st VIX future daily settlement, 20 day average. Source TCM
One of the most important metrics in our Vol Dashboard, the steepness of the VIX futures curve (the difference between the prices of the first and second VIX futures) is an excellent indication of the strength and magnitude of the recent trend in the VIX. In contrast to its stubborn flatness in Q1 while recovering from 2018’s end-of-year shock, since late March the VIX curve has returned to its more typical upward slope– the signature of a solid trend lower in VIX and a constructive environment for Alpha Seeker. While risk assets in general also tend to do well during such periods, Alpha Seeker is set apart by its ability to profit in much the same from a steeply inverted VIX curve during stressed markets when risk assets are often declining. This feature is easy to overlook while markets are rising. On the day when there are no rising assets left to chase, its benefit will be invaluable.
FINDING YOUR BALANCE
Conceptually, an investment’s return is simply the result of its capture of the “ups” and “downs” of the market over a given period. Over time, a portfolio is optimized by finding the mix of “up-capture” and “down-capture” appropriate for an investor’s risk tolerance while considering the full range of likely outcomes over a market cycle.
Many investors assume that beating the market requires maximizing up-capture while stomaching the resulting volatility (down-capture). Recently, others have taken the opposite approach, advocating low volatility (reduced up- and down-capture) as the next “holy grail”. As usual, the actual solution is more complicated than a single factor and does not lend itself well to the short attention spans of today’s typical investor.

Hypothetical growth of $1000 using historical capture ratios applied monthly to S&P 500. Source: TCM
Rather than a “bad day preventer”, the system at Thompson Cap was designed with entire market cycles in mind, seeking to produce a mix of up- and down-capture that leads to better outcomes over time. While the ratios produced by Alpha Seeker and Smart Index have led to superior results in the few years since inception, the potential becomes even more compelling as the time frame is extended. Applying historical capture ratios to past monthly returns of the S&P 500, the chart above compares theoretical outcomes of Alpha Seeker and Smart Index with the S&P 500 Low Volatility Index and an “aggressive” (1.2 Beta) equity portfolio over the two market cycles since 2000. No strategy will be perfectly consistent, but the potential of even a slight improvement in risk management is obvious if only investors would choose not to surrender it.


